Local Service Businesses
Business performance dashboard
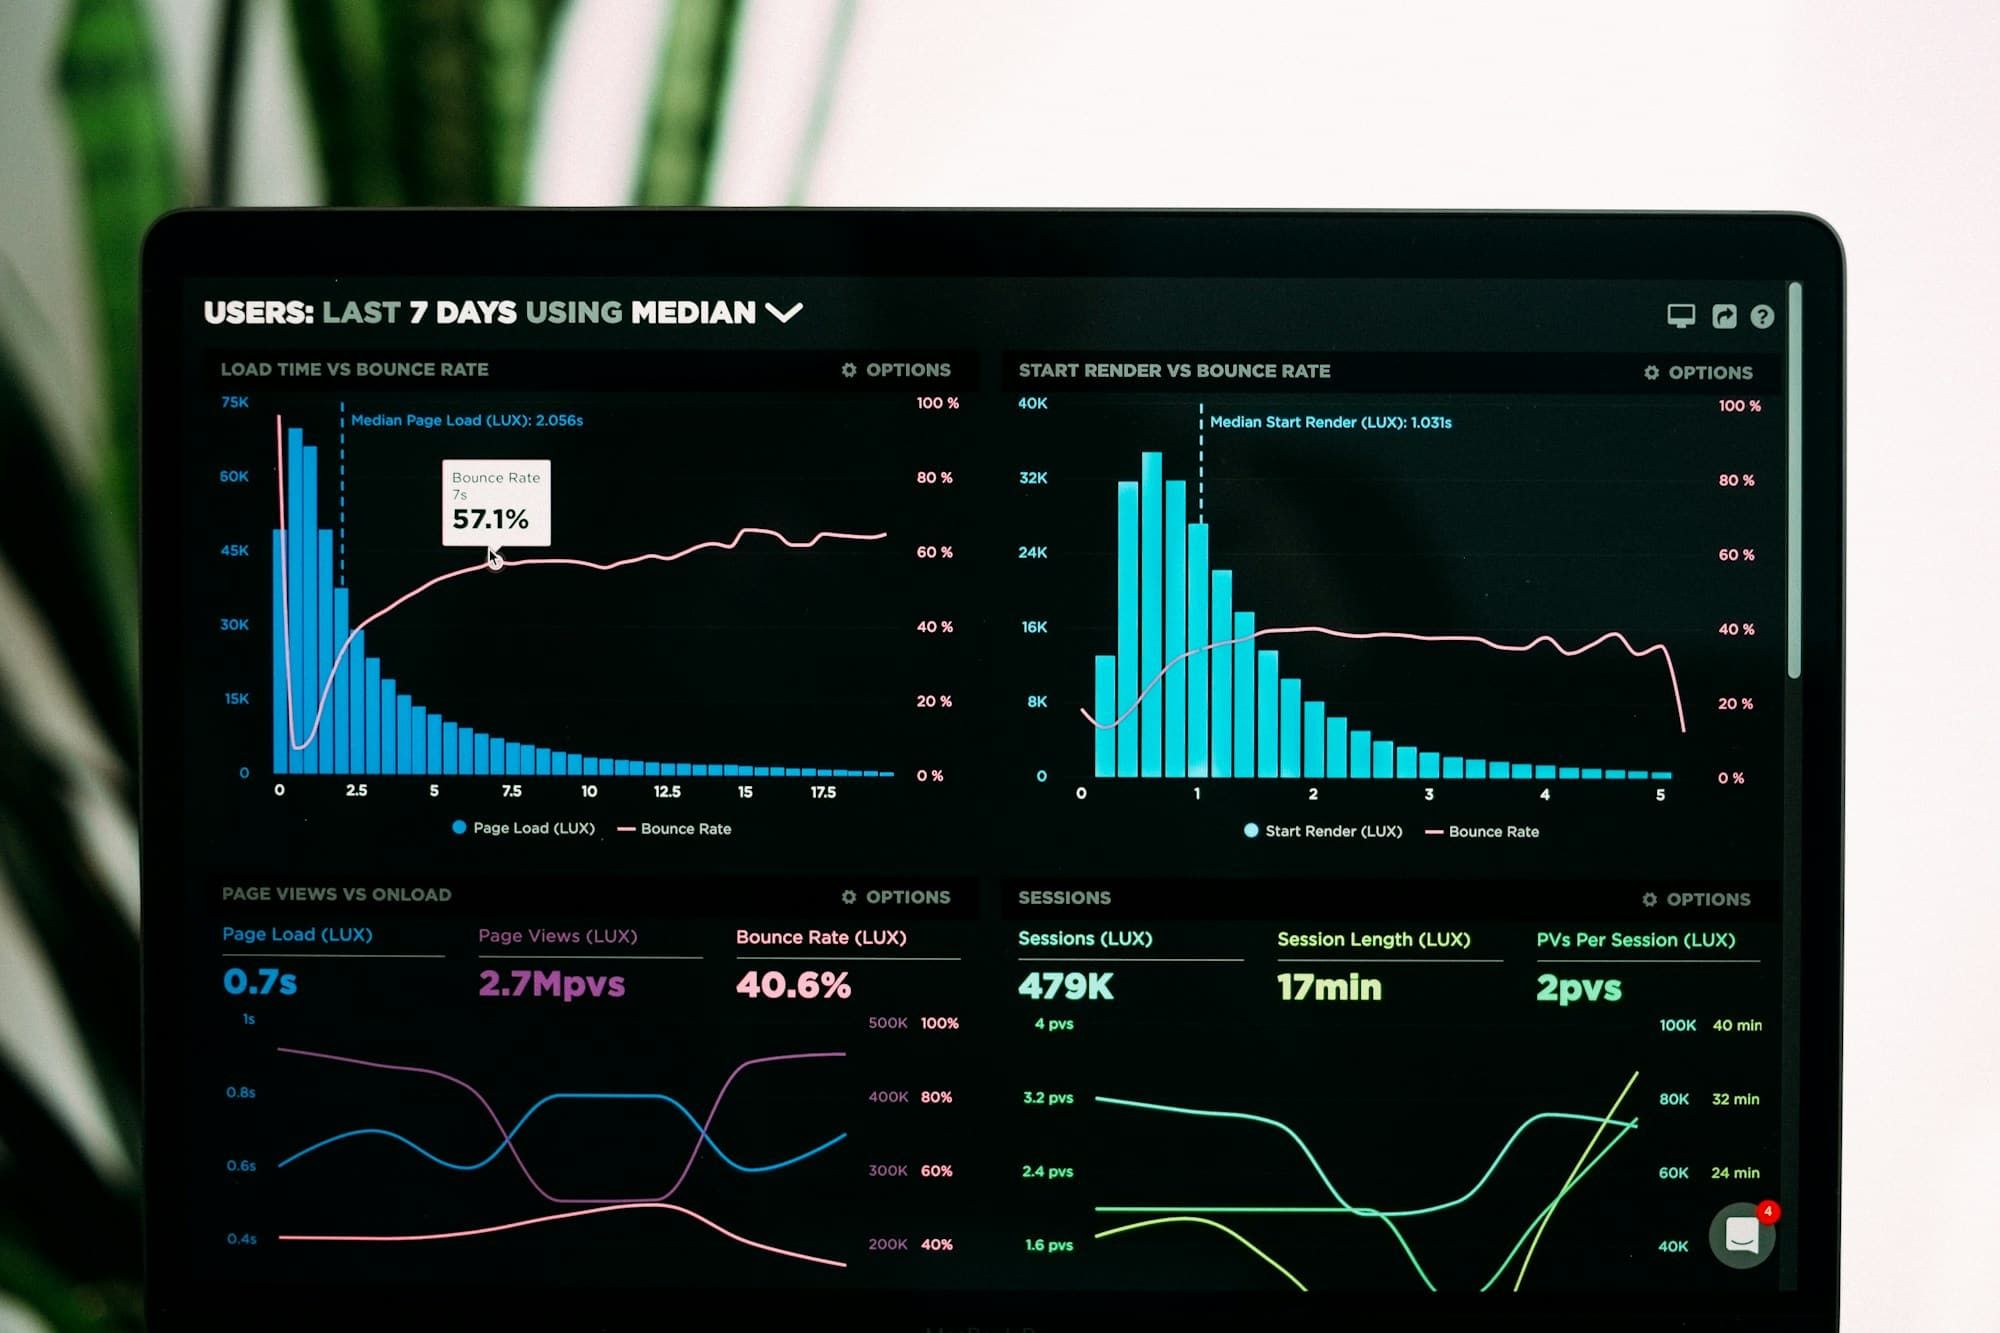
The figures an owner checks every week, brought from the tools the business already uses into one clear dashboard.
The problem
Sales are in one system, bookings in another, invoices in a third and website visits somewhere else. Pulling them together means logging into each tool or building a spreadsheet by hand, so it's done rarely, and the numbers are out of date by the time anyone looks.
What we'd build
We agree the handful of figures that matter, then bring them together from the tools the business already uses into one dashboard. Data refreshes on a schedule, such as daily or hourly depending on the source, and each figure shows when it was last updated, rather than pretending to be live. We check which of your tools can connect before we start, because not every tool allows it, and where one can't, a simple upload or a spreadsheet fills the gap. Where an existing reporting tool does the job, we set that up properly rather than building something new.
Key features
- The few figures an owner checks each week, on one screen
- Figures from tools such as accounting, booking or sales systems, spreadsheets and website statistics, where they allow a connection
- Scheduled refresh, with the last-updated time shown
- Simple trends over time
- Access limited to the right people
- A walkthrough of how to read it
This is based on a typical business, not a specific client.
Services
The services behind it
Business Dashboard
One private place to run the work we automate for you, built around your business and improved every month.
Learn more ServiceAnalytics & Reporting
Google Analytics, Search Console, conversion tracking and reporting dashboards.
Learn more ServiceConnecting Your Tools
Your website, booking, email, CRM and accounting tools passing information automatically.
Learn moreMore
Other solutions

Construction & Trades
Trades enquiries to invoices, connected
Proven tools set up and connected for a trades business, so enquiries, quotes, jobs and invoices stop living in a notebook and a phone.
See how it works
Property & Estate Agencies
Lettings admin, automated
Small automations for a letting agent: maintenance requests routed properly and certificate renewals flagged in good time.
See how it works
Construction & Trades
Online quote requests with automatic follow-up
A step-by-step quote request form that gathers the right details first time, then follows up automatically so enquiries don't go cold.
See how it worksLet's talk about what your business needs.
Whether it's a simple website or a complex business system, tell us what you're trying to achieve and we'll recommend the right approach. No jargon, no obligation.